Researching Researchers
Overview
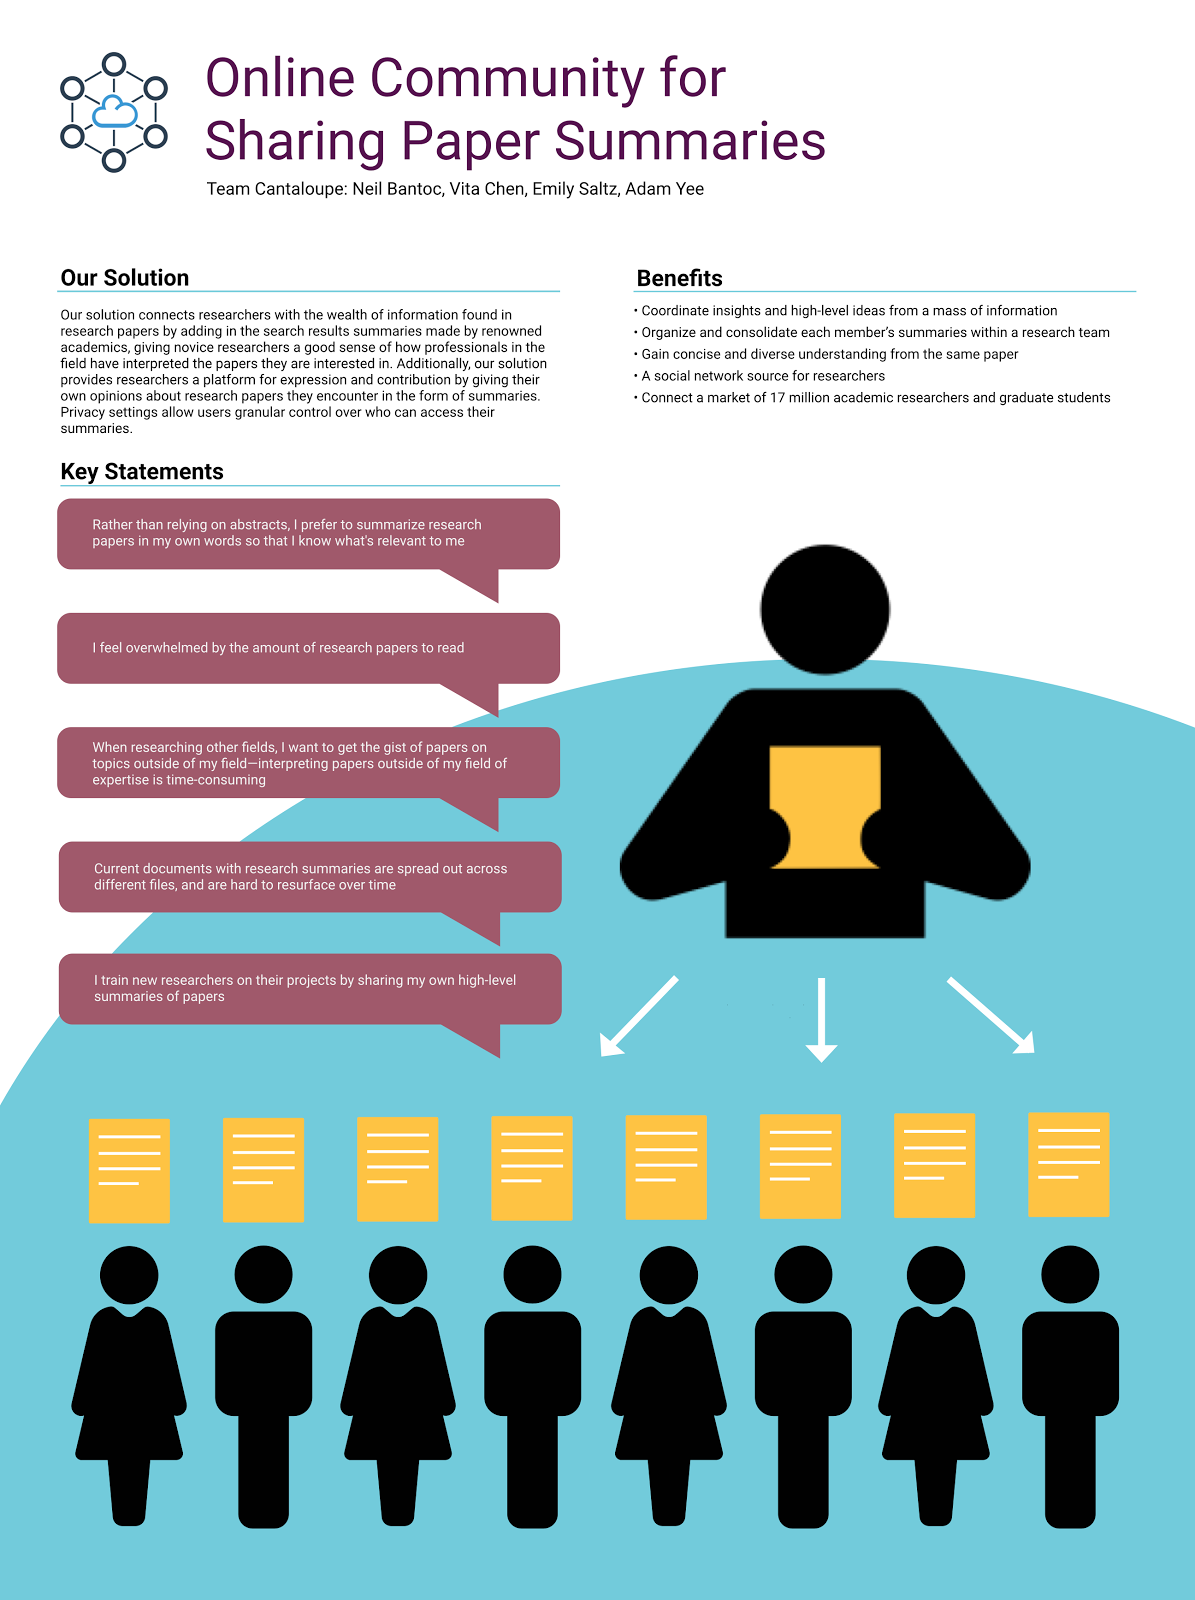
A user research project using Contextual Inquiry methods to define pain points in the academic paper-writing process. Our final deliverable after over two months was a poster concept for a solution tackling how research teams synthesize insights during literature review.
Role
Design Lead
Team
Adam Yee, Vita Chen, Neil Bantoc
Methods
Figma, Sketch, Contextual Design, Speeddating, Improv Visioning
The problem
Our stakeholder was the search analytics company uReveal. uReveal sought deeper understanding of the workflow of their acadamic users in order to learn what kinds of tools they could create to better address breakdowns in the research process.
Process
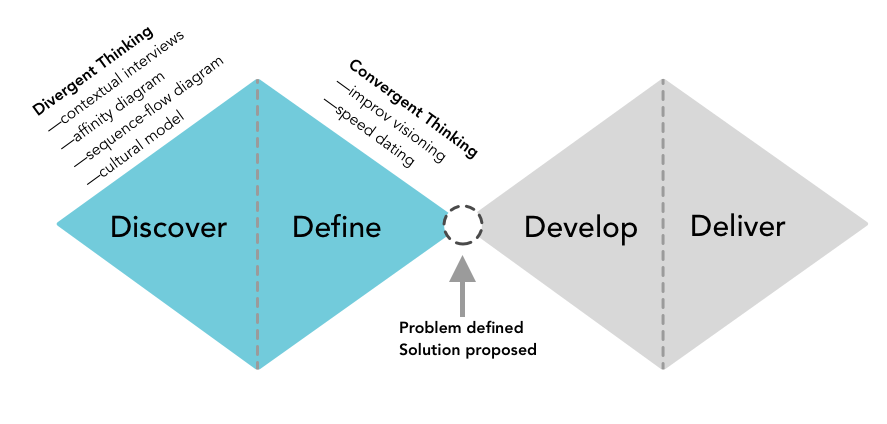
Our team focused on discovering the current process of academic users in the context of writing a research paper. With our research findings in hand, our team articulated a problem statement and used visioning techniques to narrow down to our final concept: a platform for sharing research summaries.
Contextual Inquiry
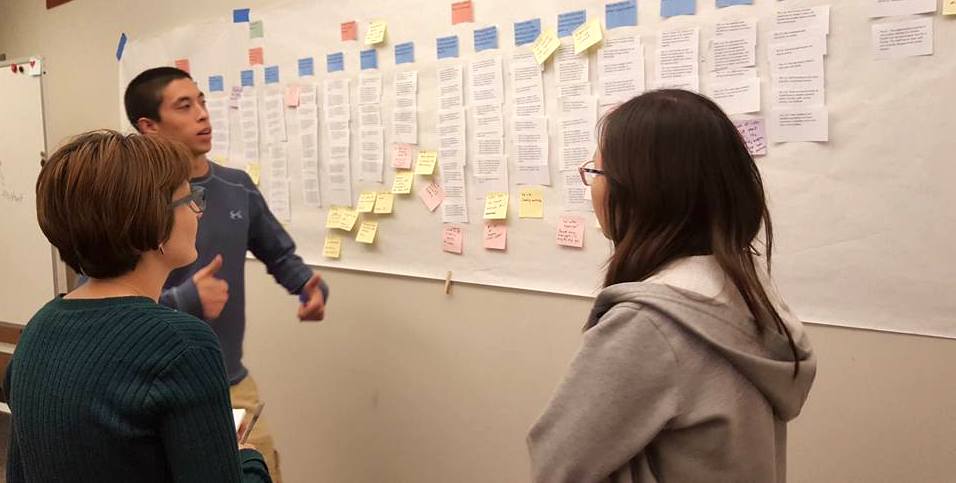
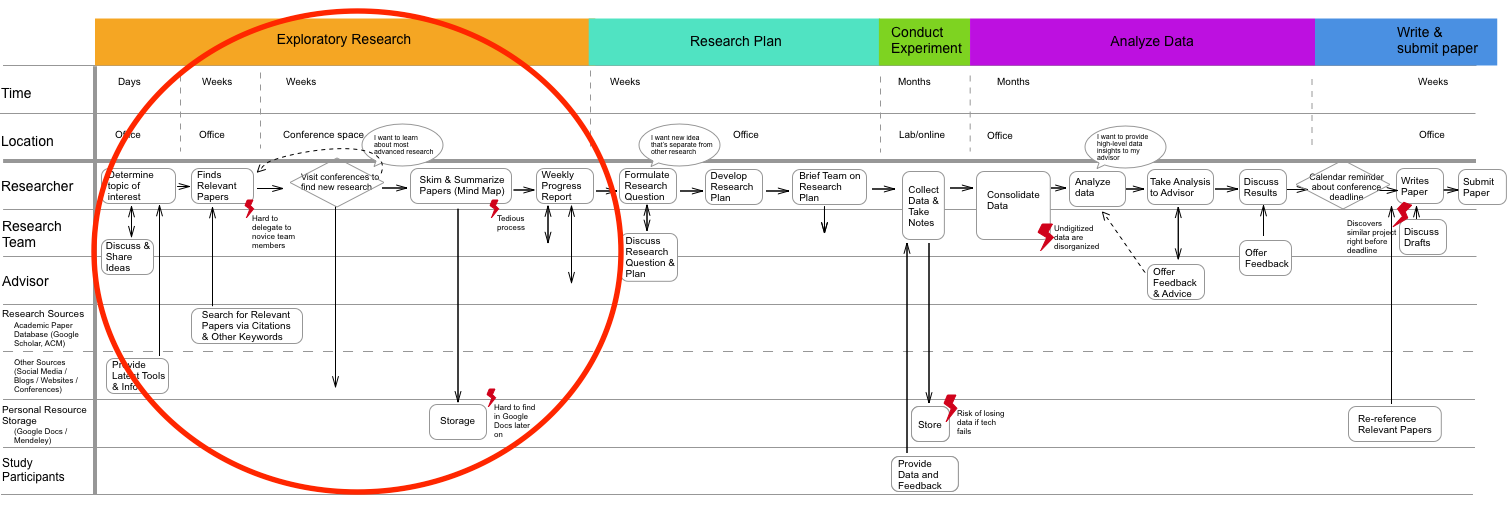
Our team conducted hour-long interviews with PhD students and professors at Carnegie Mellon to understand the academic research process. After analyzing our interviews in interpretation sessions, we created a sequence-flow diagram synthesizing the with research tasks and timelines that were common across interviews. We noticed a cluster of breakdowns during a phase we identified as "Exploratory Research," which includes the literature review process.
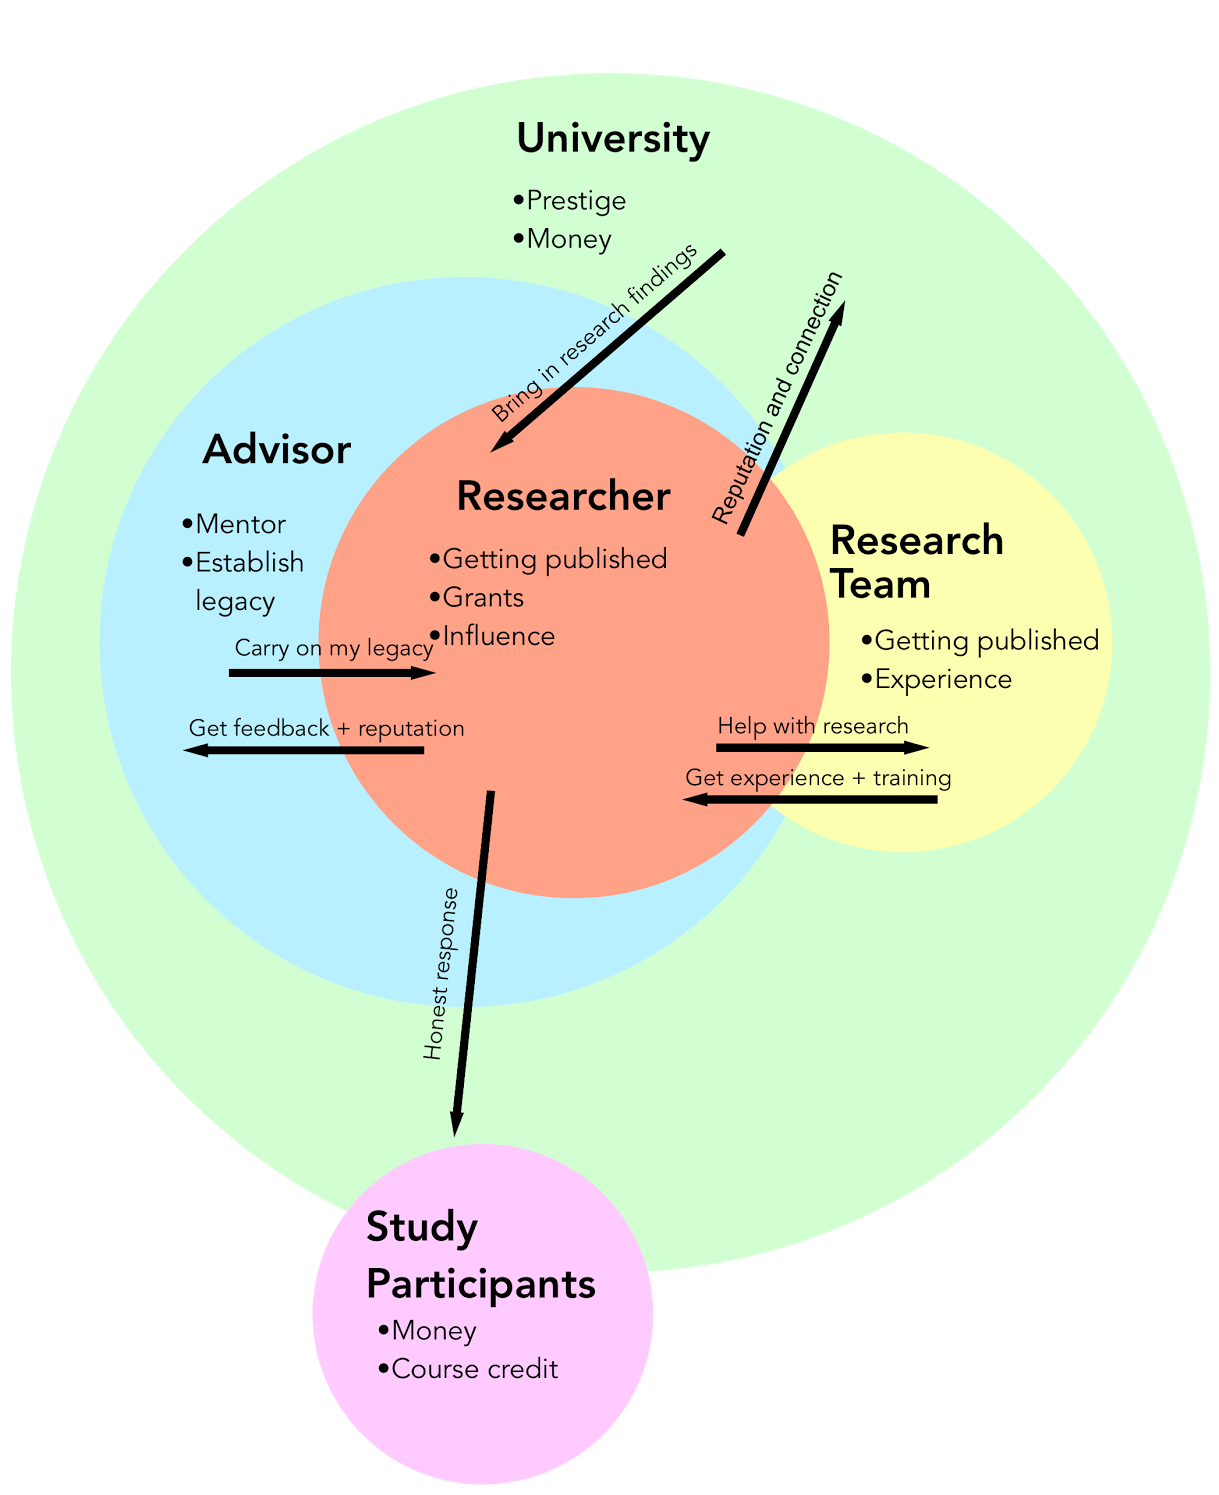
We also considered the sequence-flow for academic researchers in the context of a cultural model and affinity diagram clusters. this with our cultural model of research stakeholders, and considered how the breakdowns might be related to the varied intents from researcher to researcher, where junior researchers are more interested in gaining personal experience and influence, whereas more senior advisors may be be more interesed in mentoring junior researchers to carry on their legacy.
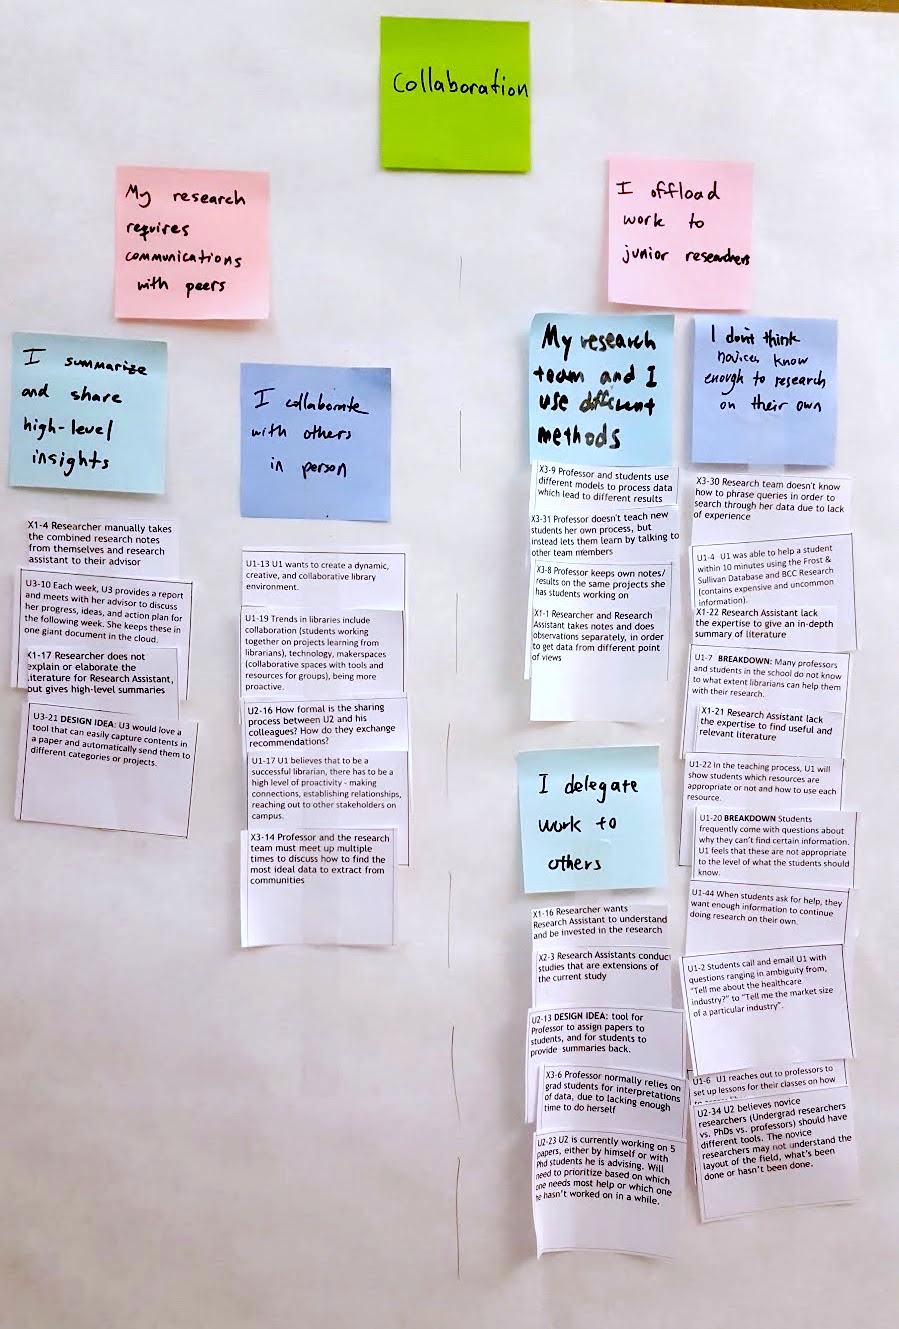
Our affinity diagram also revealed insights about how researchers collaborate with each other, noting that breakdowns occured when researchers used different literature review methods, and when more established researchers had to communicate context to researchers who had less experience in the field.
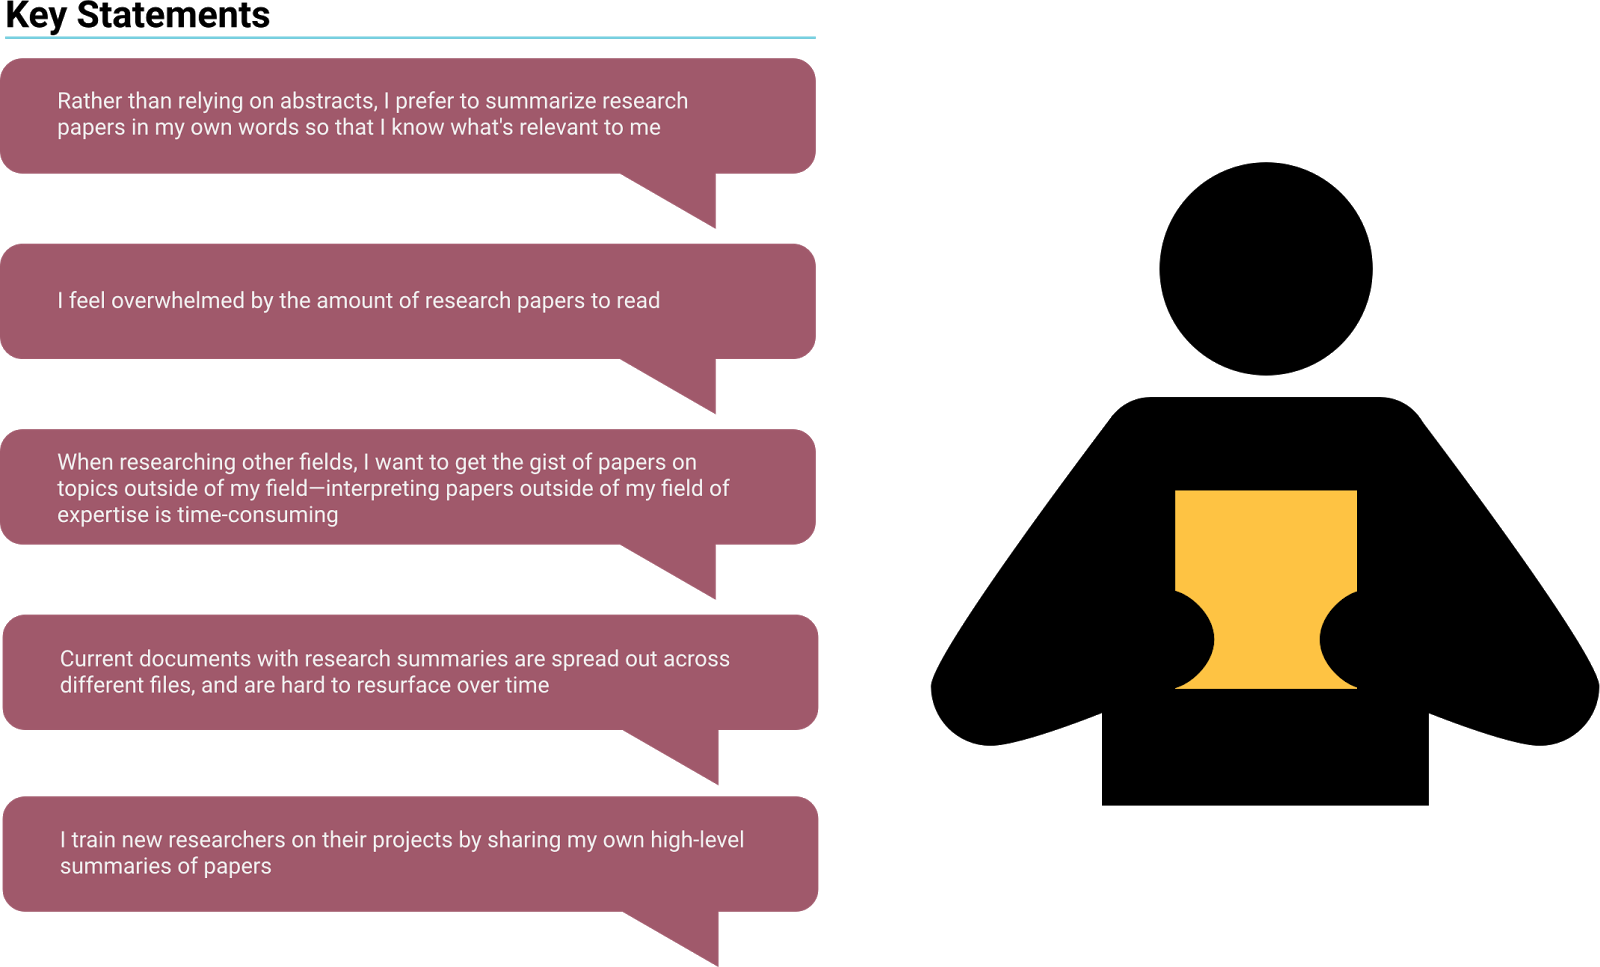
Our team zoned in on several key statements unearthed during our research discovery phase, related to the challenge of summarizing findings from literature review across members of a research team with varying levels of experience.
Visioning
With these insights in mind, we moved on to the visioning phase of our process in order to narrow down to a concept. We started with quick improv sketches with the whole team, creating scenarios around alternative literature review processes.
As we threw out wild ideas and conceptualized them as scenarios, we were able to identify promising solutions, as well as generate questions about potential pitfalls of these solutions.
Next, in order to probe potential users about some of our assumptions and questions about potential solutions, we used the "speeddating methods." We drew out several refined scenarios pulled from the improv visioning that addressed aspects of our designs we were uncertain about, such as feelings around privacy if researchers shared summaries from their literature review.
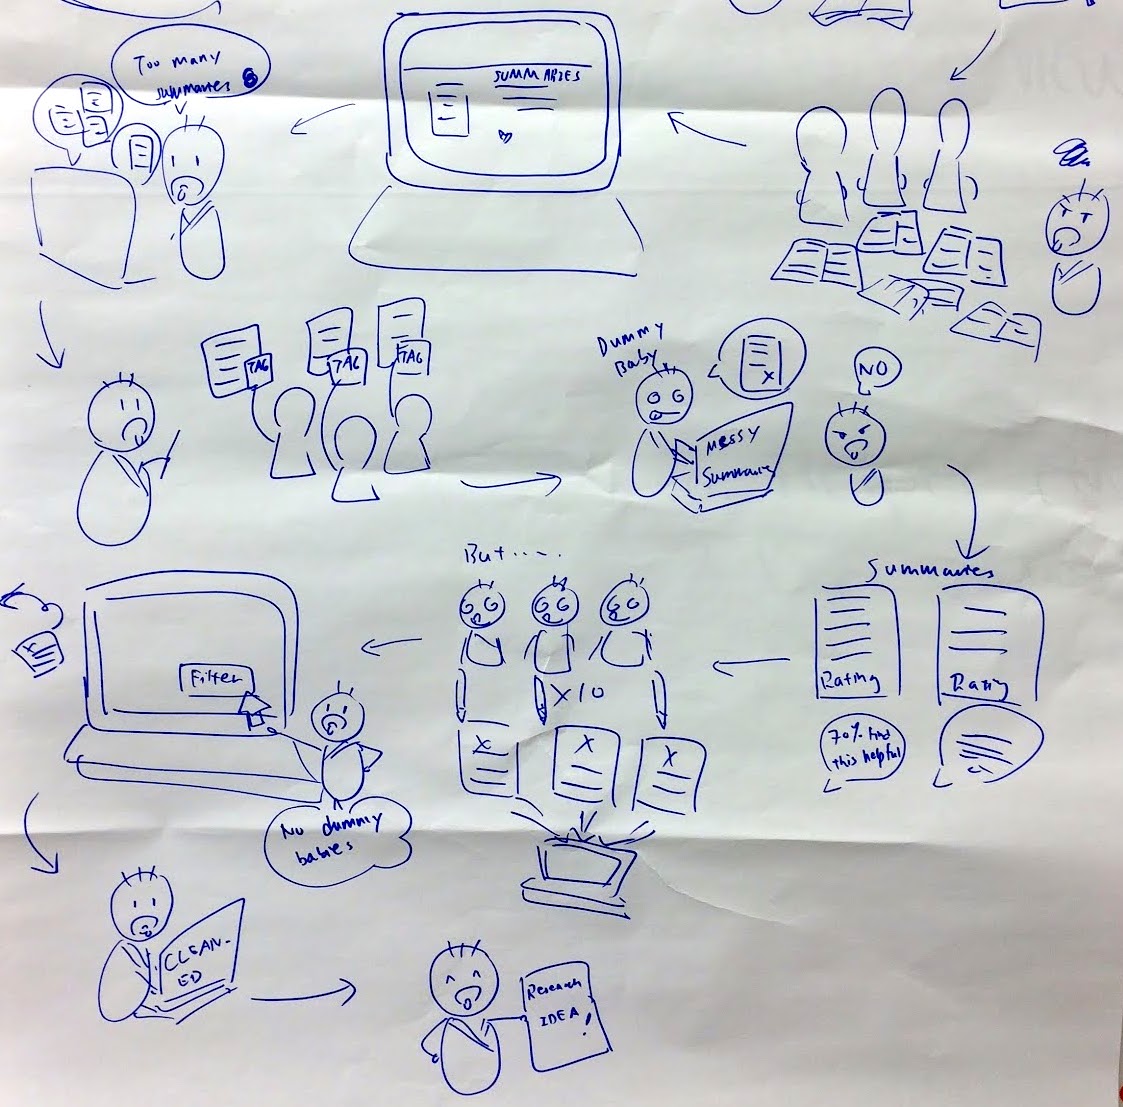
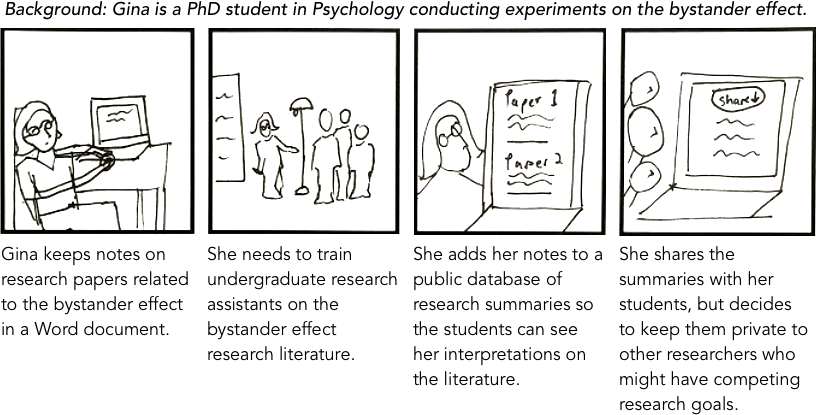
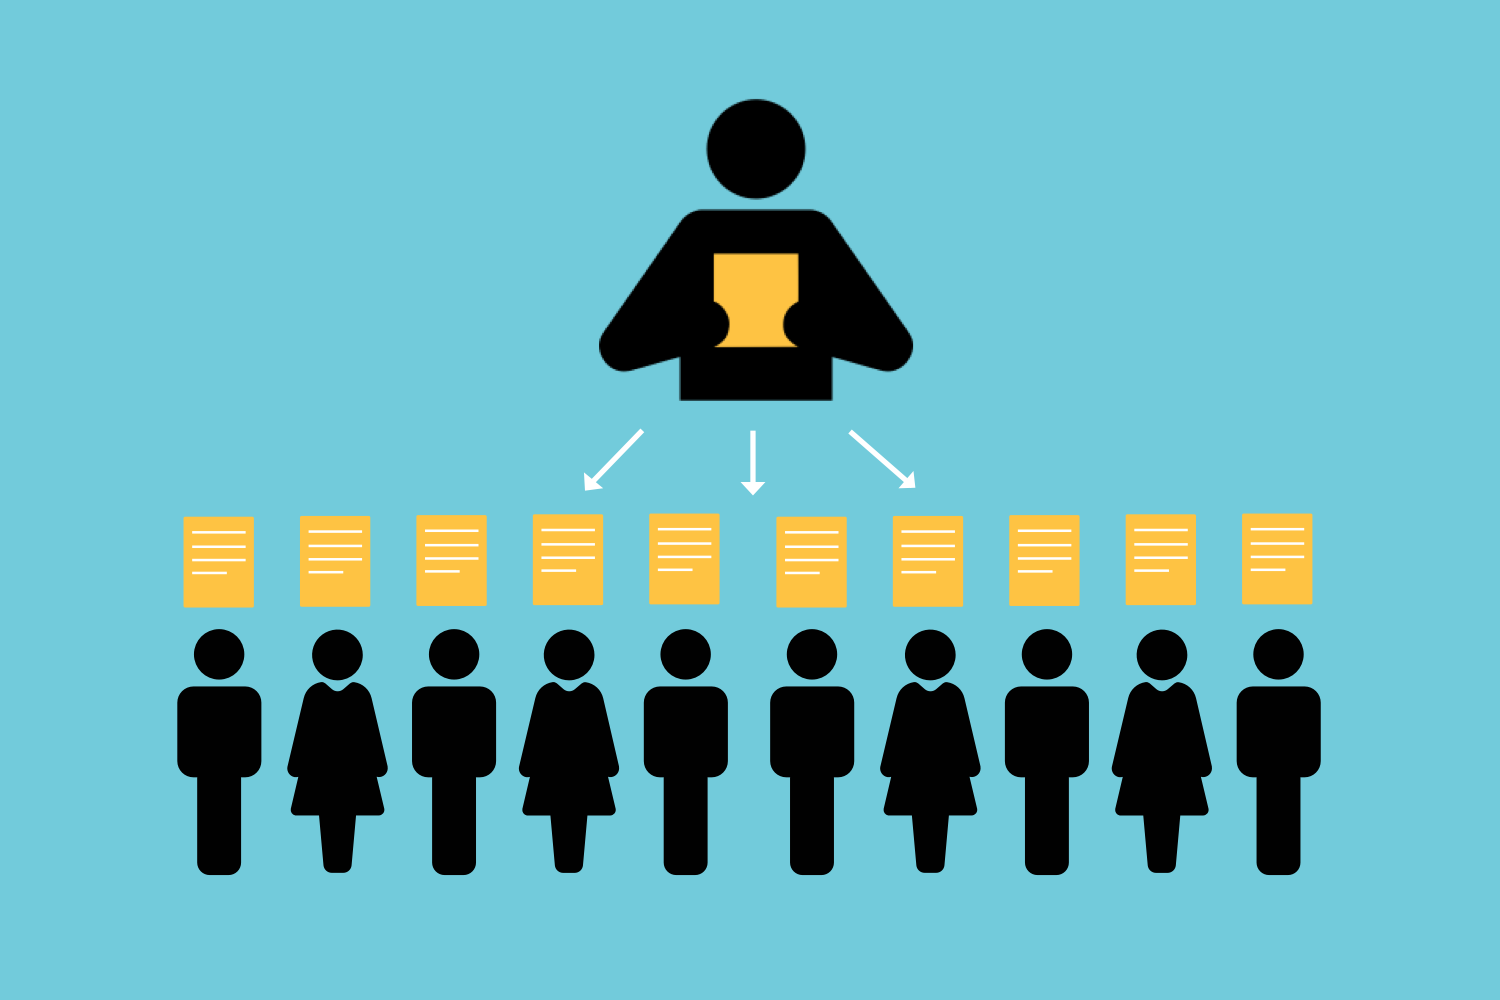
We used these insights to decide on our final concept: a social platform where researchers can share and comment on paper summaries. This solution allows novice researchers to understand the gist of research literature in the context of the specific perspectives of relevant researchers, as well as browse insights from researchers across fields. In addition to this, more established researchers can share knowledge and establish influence within their field.
Final Poster