CoPilot for Philips Healthcare
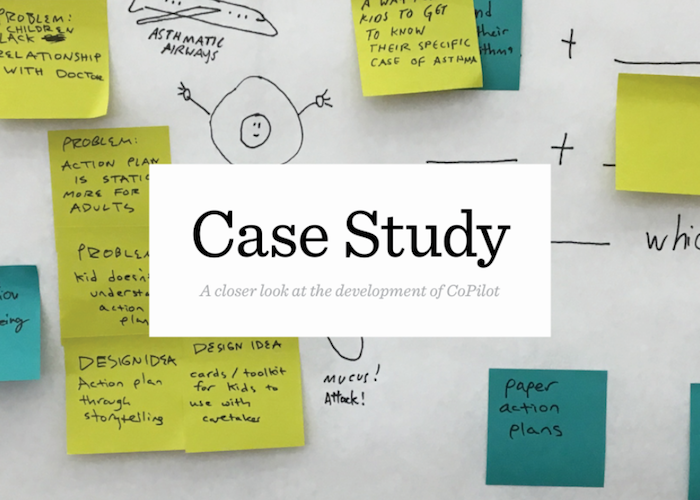
Overview
Asthma management for children: Navigate to clear airways together. Worked with a team of five people to prototype a data-driven solution to help children and their care networks manage asthma systems.
Project Details
Role
UX Researcher & Interaction Designer
Tools
Sketch, Adobe Illustrator, Tableau, Mural
Team
Jeffrey Chou (Tech Lead), Michelina Campanella (PM and Data Design), Raphael Weikart (Graphic Design), Clara Kim (UI Design)
Design
CoPilot is an iPhone app service concept to make it easy for parents, teachers and children to react in real time to changing asthma triggers in the environment. Children and their care network receive customized, actionable recommendations whenever environmental allergens pass a child's personal threshold for alert.
Design Brief
About 10% of children in the US suffer from asthma. While medication and good habits can help keep childhood asthma under control, it requires coordination between children and their care network to manage the child’s triggers for asthma. Often, children and their caregivers lack basic awareness of the best medical practices for managing and adapting to changing asthma symptoms.
Philips posed the following questions to our team:
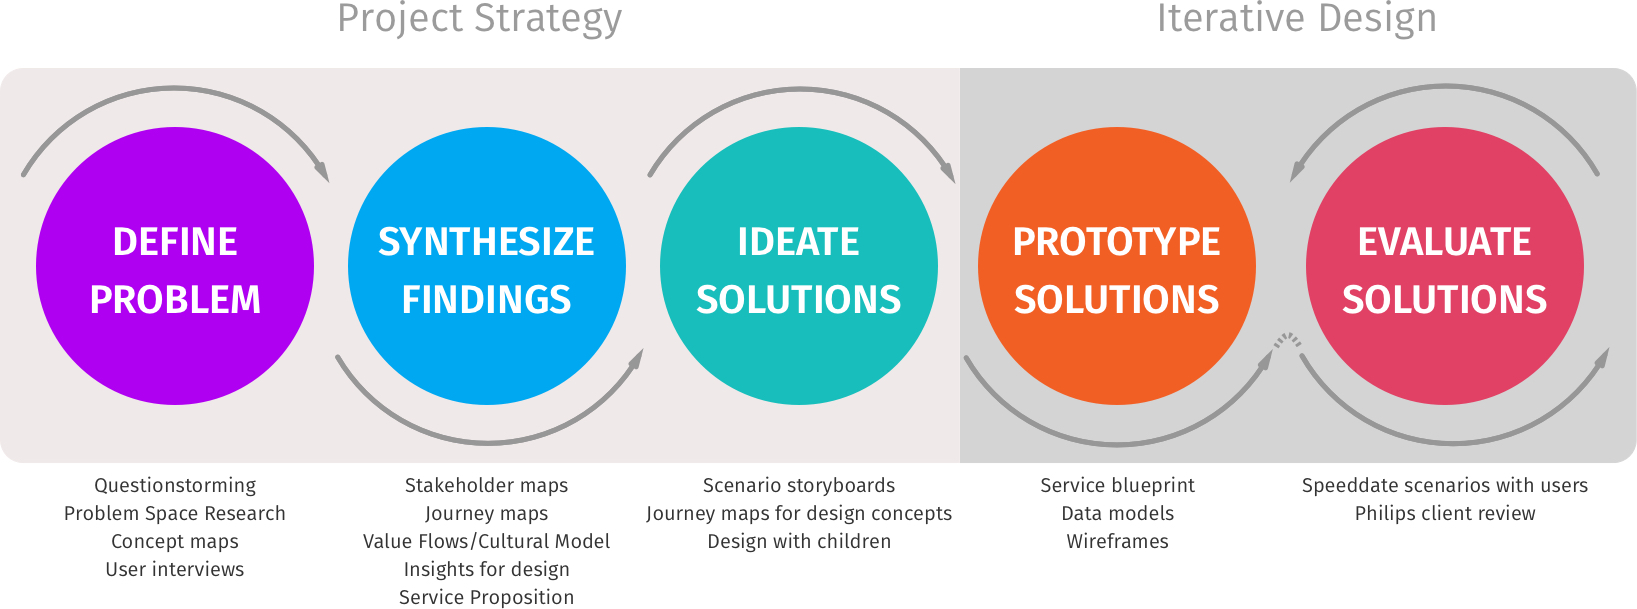
Process
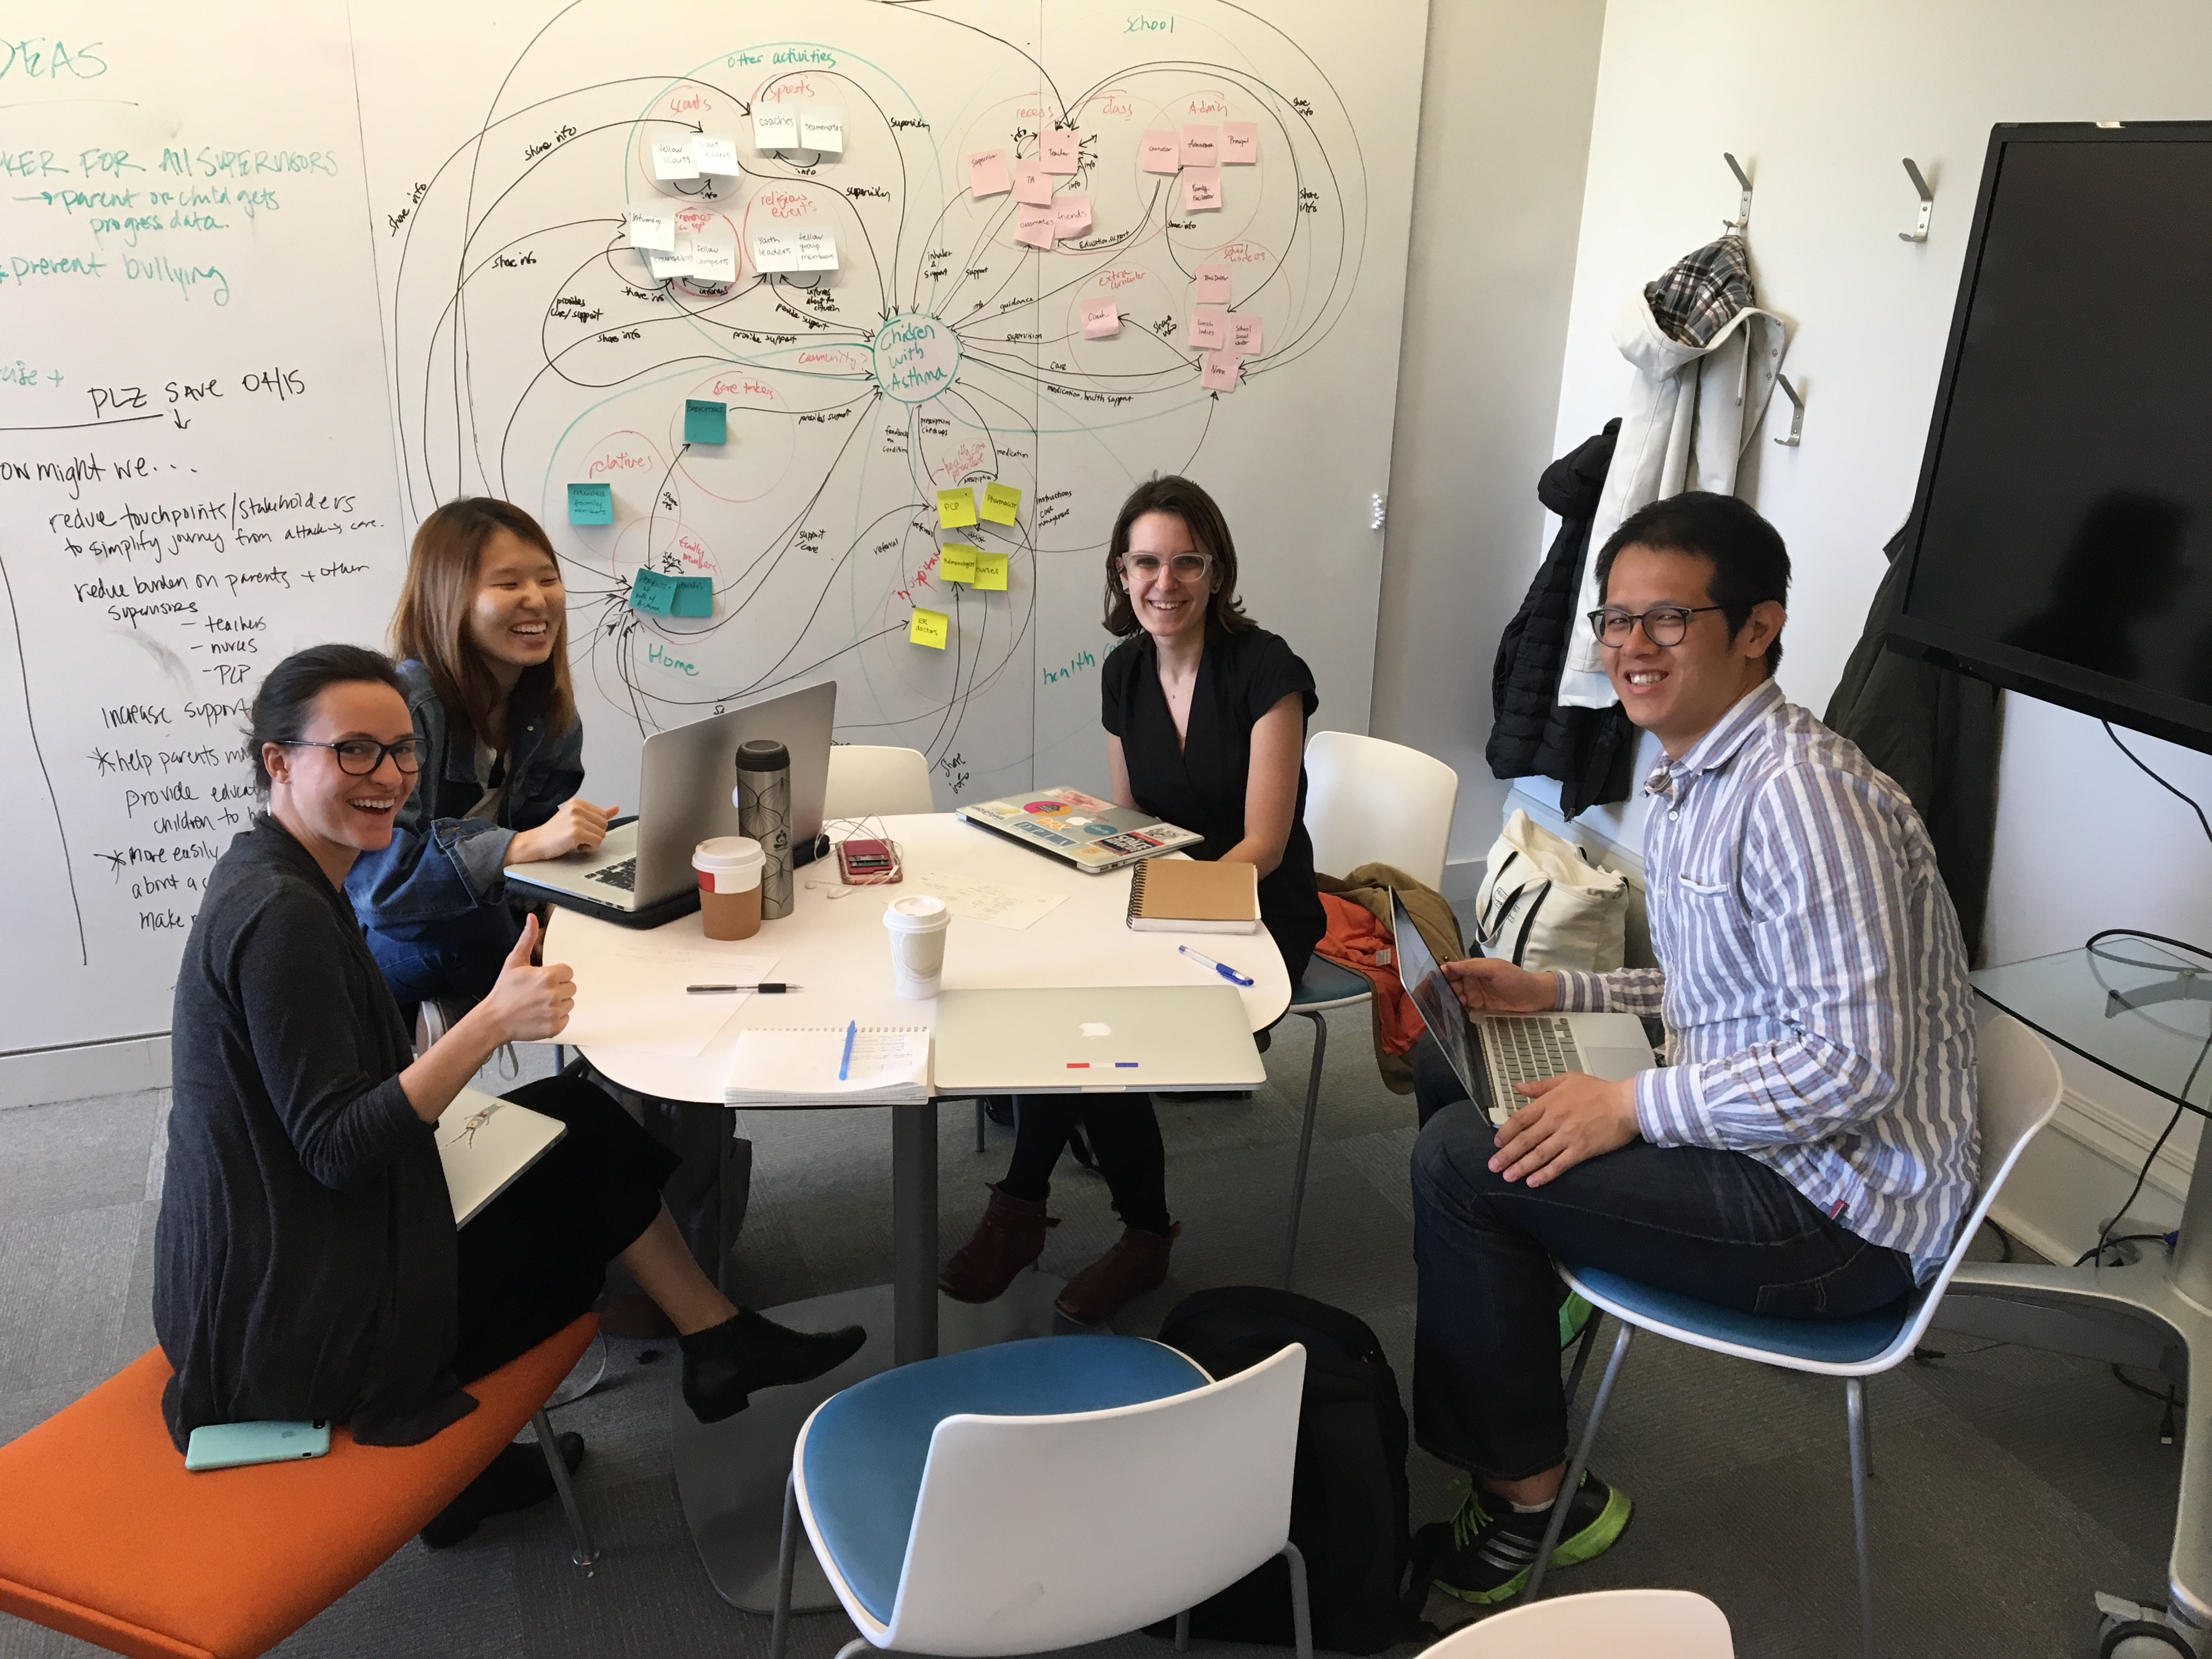
To tackle this problem, our team began to wrap our head around the problem space and outline our project plan. We documented our process for Philips Healthcare through regular posts on Medium.
Define Problem
Secondary Research & Exploratory Interviews
We created a field guide and conducted several informal interviews in order to learn more about the problem space and define our goals. We spoke with two students who had suffered from asthma as children and one behavioral therapist at a middle school who works with children with asthma.
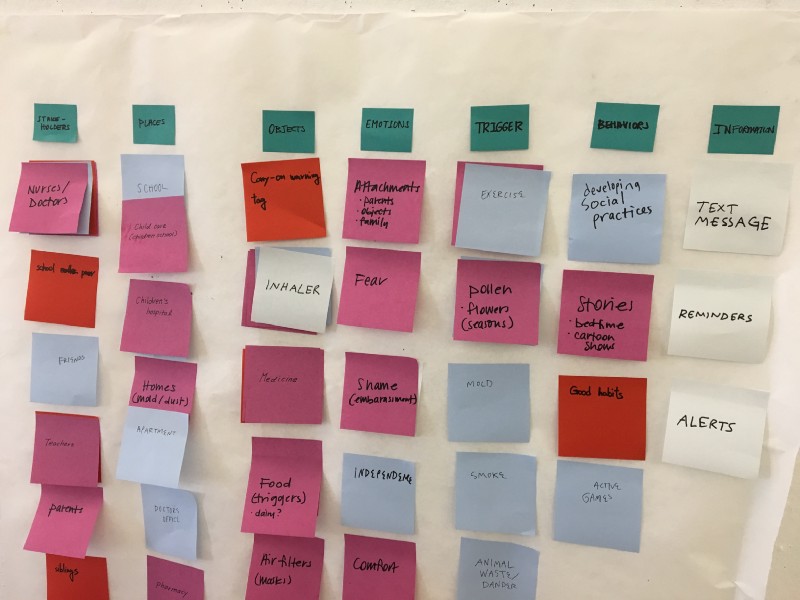
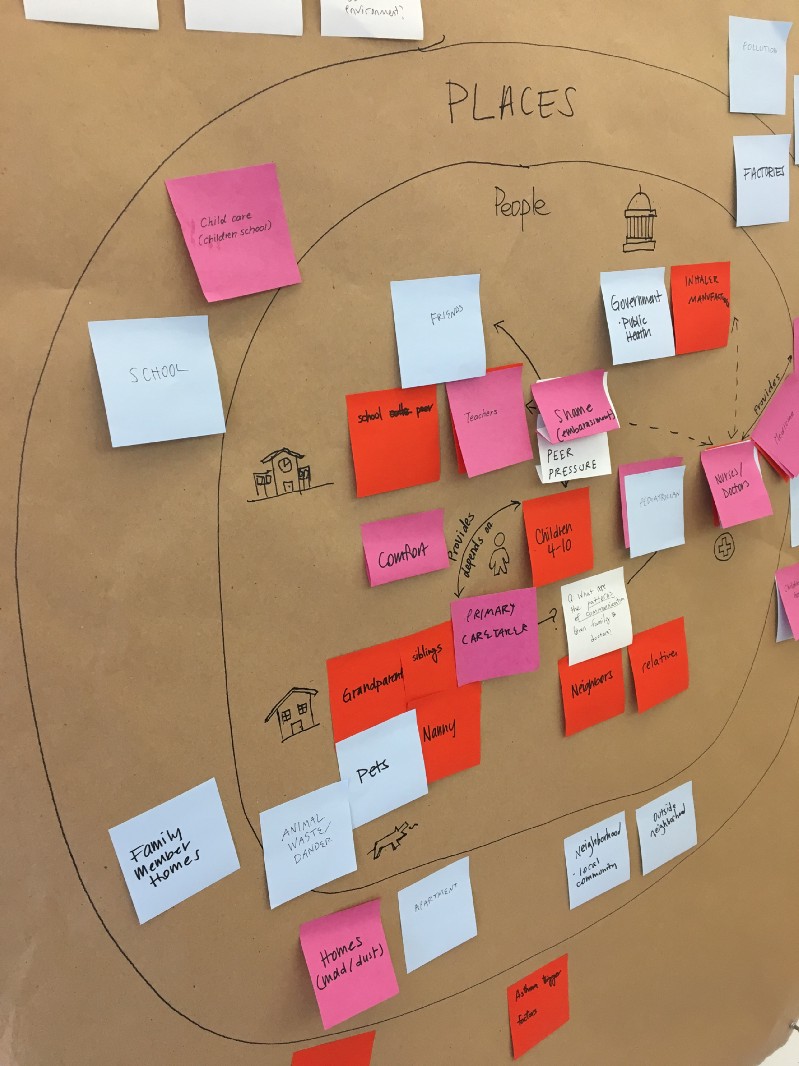
At the same time, we broke down all major concepts related to the prompt, sorting them into major categories including stakeholders, places, objects, emotions, triggers, behaviors and information. We used these concepts to guide our secondary research and exploratory interviews. We also brainstormed our questions around the prompt, for example: how do caregivers communicate out a child's asthma? What kind of treatment regimens exist? How strictly do children follow these treatment regimens? How much do children understand about their triggers, and how much do they care? We began sensemaking our findings by sharing our sketches and notes, clustering ideas into affinity groups.
“I wish I'd had a tool to say ‘yes, you can do this’ and ‘no you shouldn’t do that.’”
—A CMU student who suffered from allergic asthma as a child
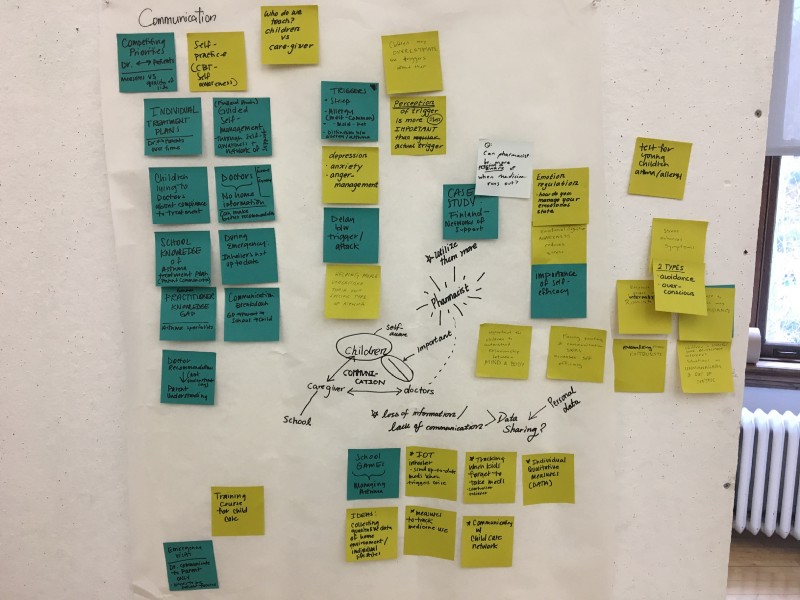
Synthesize Findings
In our research, we observed several key problem and opportunity areas.
As young patients get older, they need self-efficacy to make decisions, as there is no proven formula for optimum management, but lack of any adherence to a plan can lead to dire consequences. We also found that asthma patients benefit from an individualized asthma action plan because every asthma regimen is unique, and requires a close continuing partnership between doctor, patient, and caretakers for most effective treatment. Our research pointed us to this service proposition:
Our service is dynamic, interactive action plan for asthma that provides shareable, actionable, and dynamic guidance for kids and caregivers by incorporating both macro and micro real-time data, including the communication of child's health status and asthma triggers in a digital medium, unlike traditional static paper-based asthma action plans, which easily becomes outdated and/or forgotten.
Ideate Solutions
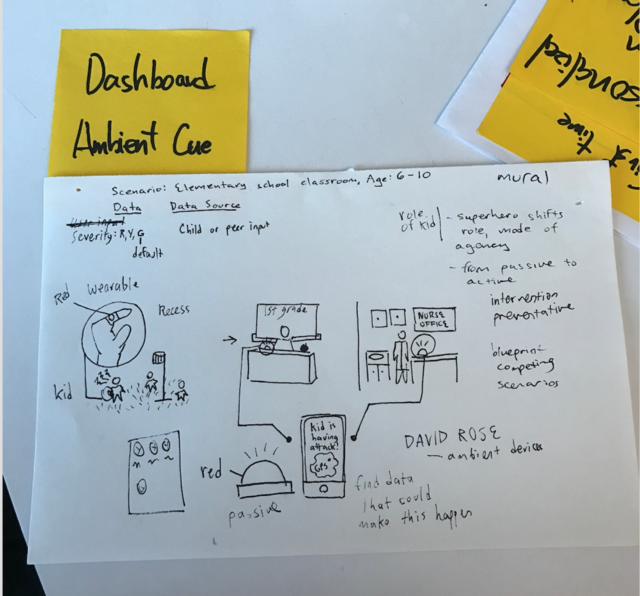
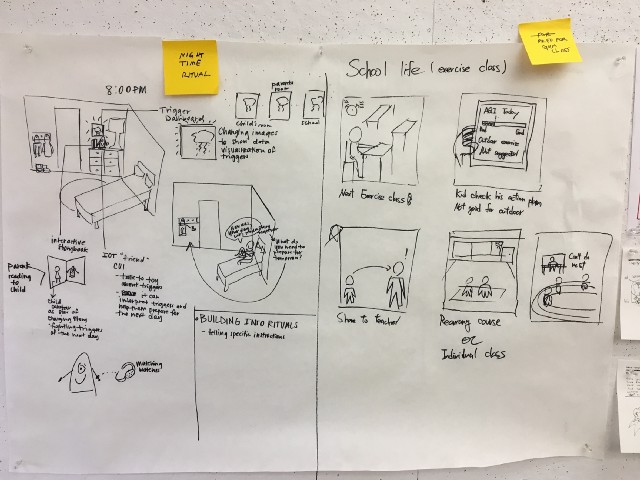
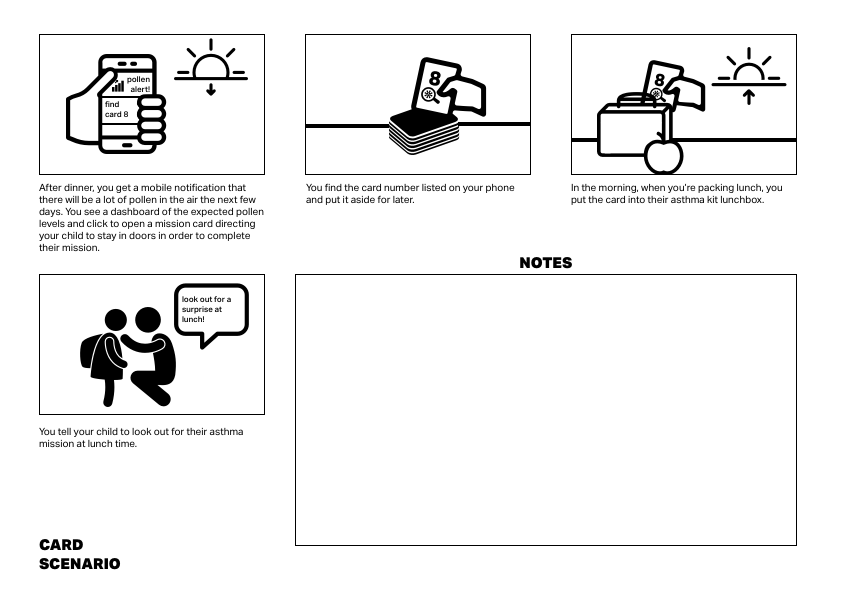
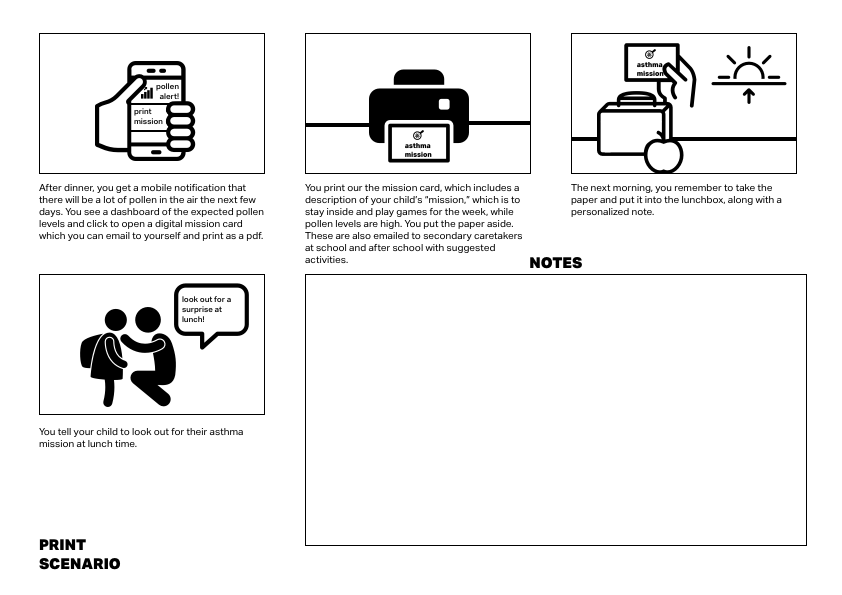
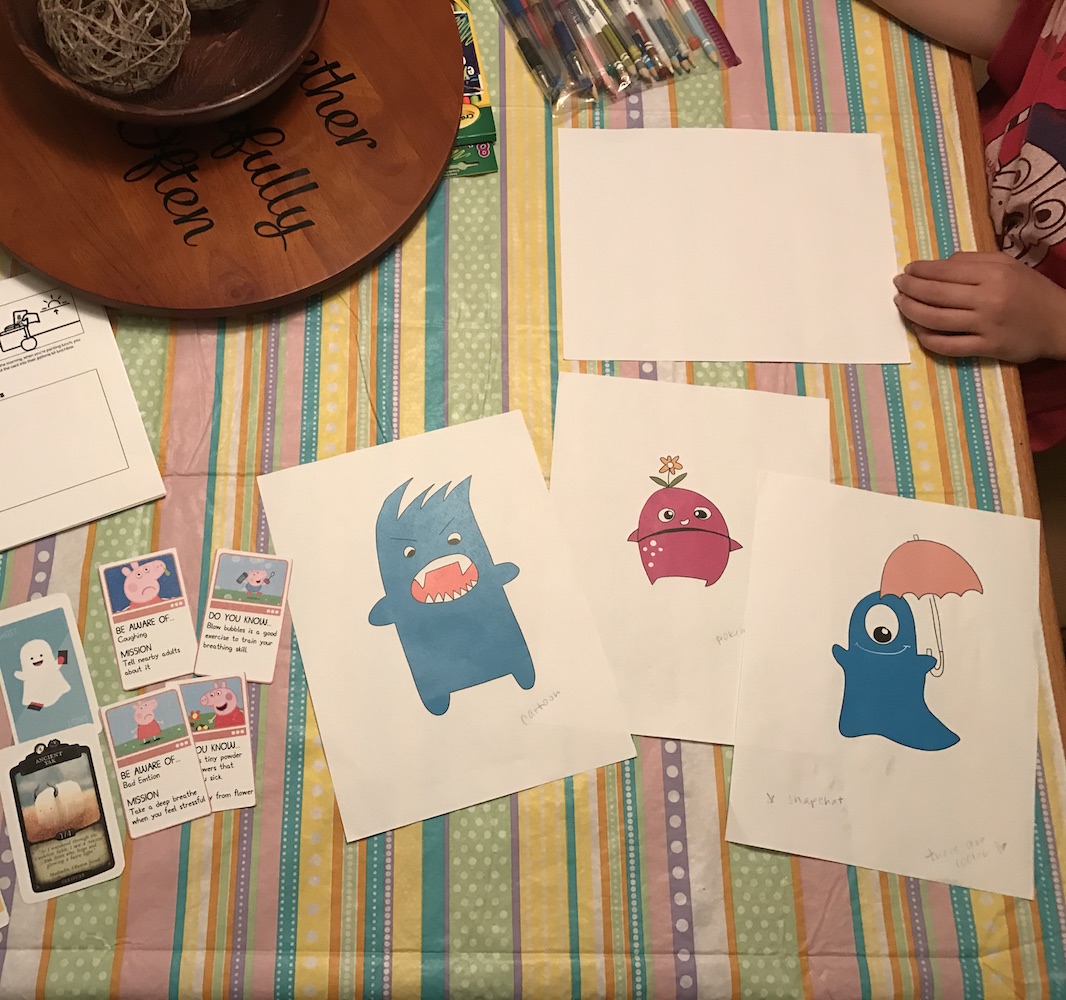
With our research insights in mind, we brainstormed potential solutions individually and as a team. Several early scenarios are shown below. Eventually, we moved forward with two ideas: a spy kit with asthma missions that a kid could bring to school, and asthma trading cards that kids could pull out of their lunchbox and be directed to a relevant asthma challenge or habit. We saw these physical tools being used in coordination with a digital platform which could provide more dynamic information and recommendations, especially for parents and other adult caregivers.
"Speeddating" with Parents
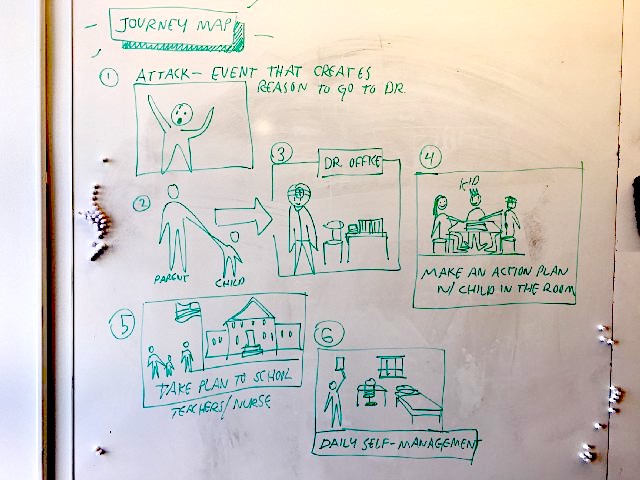
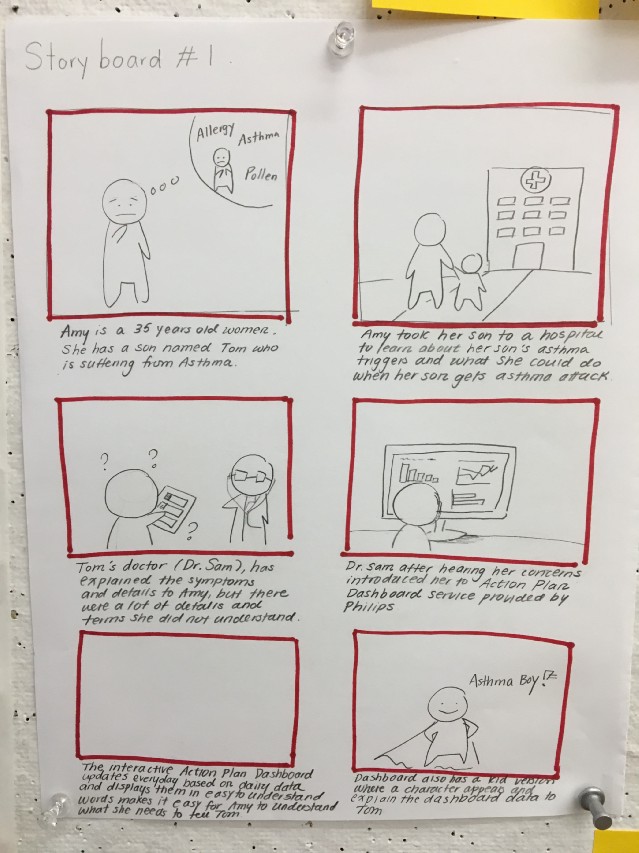
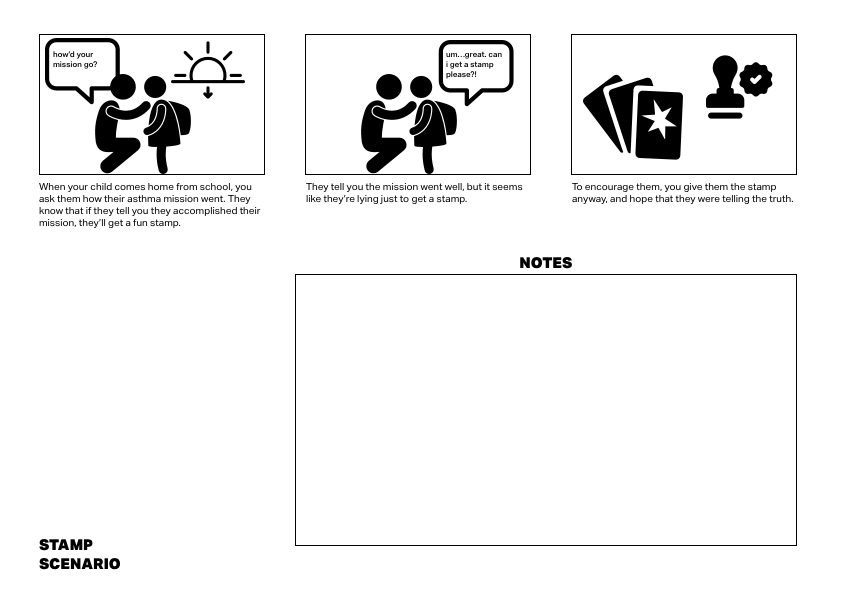
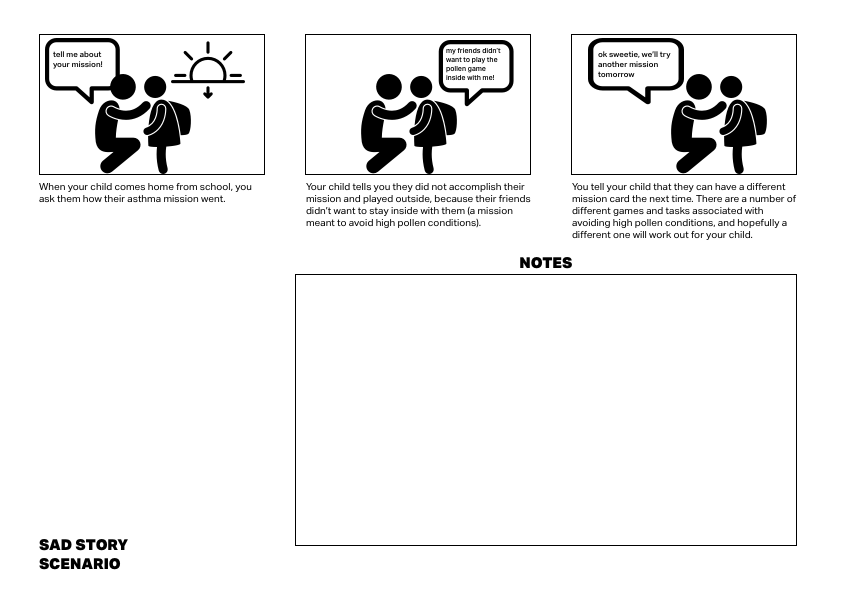
As a next step, we wanted to run some of our concepts and questions by our target users. We created a field guide of questions. As part of this field guide, I created storyboards for "speeddating" of critical moments from some of our design ideas. The speeddating method allowed our team to consider critical moments of our concept in the context of a realistic scenario. Also, when shown to the target population (in this case, parents and children), we used these scenarios as launchpads for conversation — allowing the interviewees to tell us which scenarios were more or less realistic and why. Some of the critical moments we explored are depicted in the scenarios below:
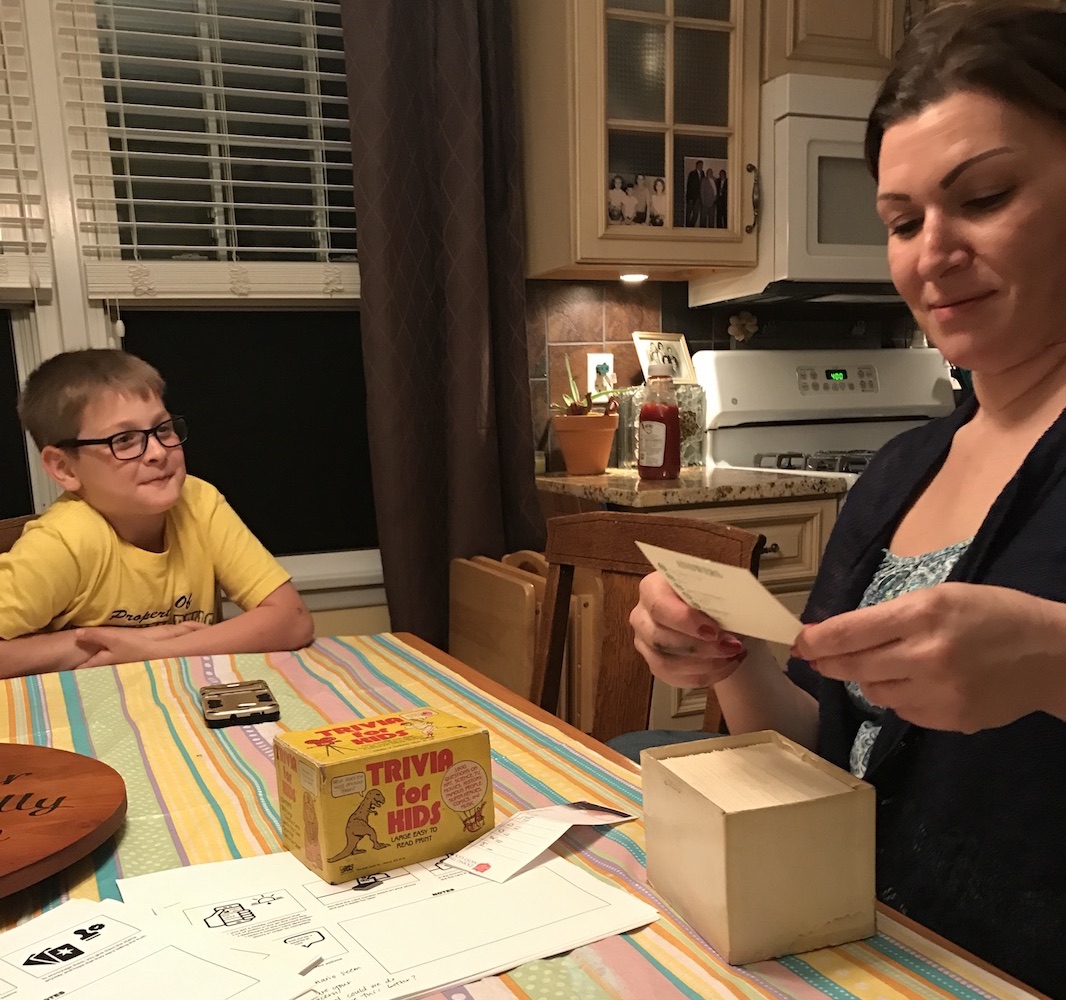
Working with Kids: Design Critique & App Mania
We sat down with a group of kids aged eight to 11 and questioned them on their design preferences and technology habits. Turns out, apps and monsters are cool, cartoon piglets are not. These conversations gave us confidence to pursue an all-digital solution for kids. This allowed us to move away from solutions involving printing or looking up physical cards to pack with the child for school — scenarios that parents told us could be unrealistic or complicated.
Prototype Solution
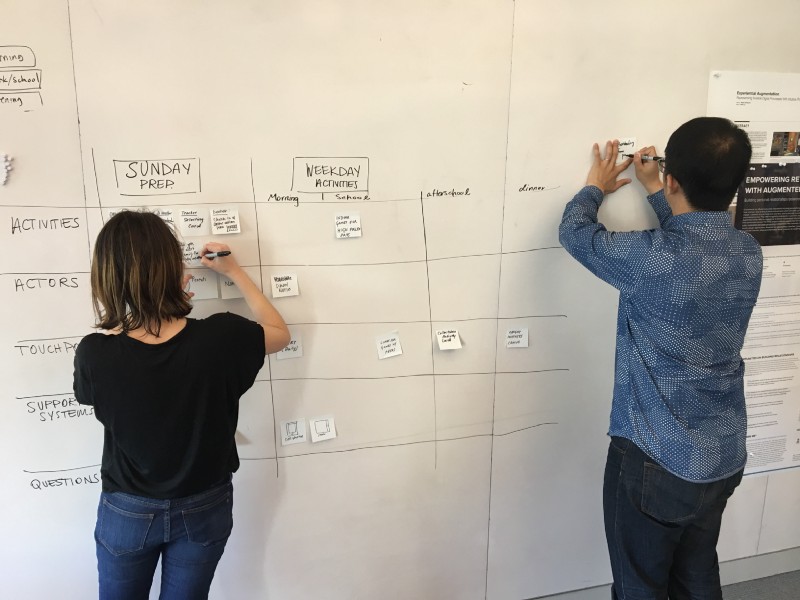
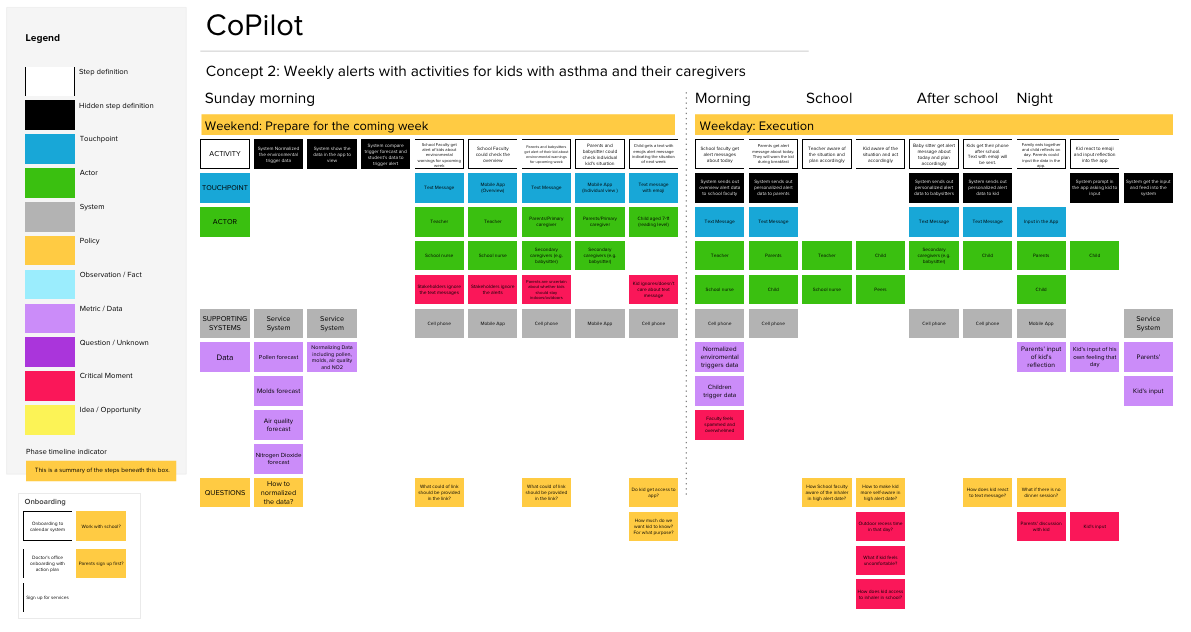
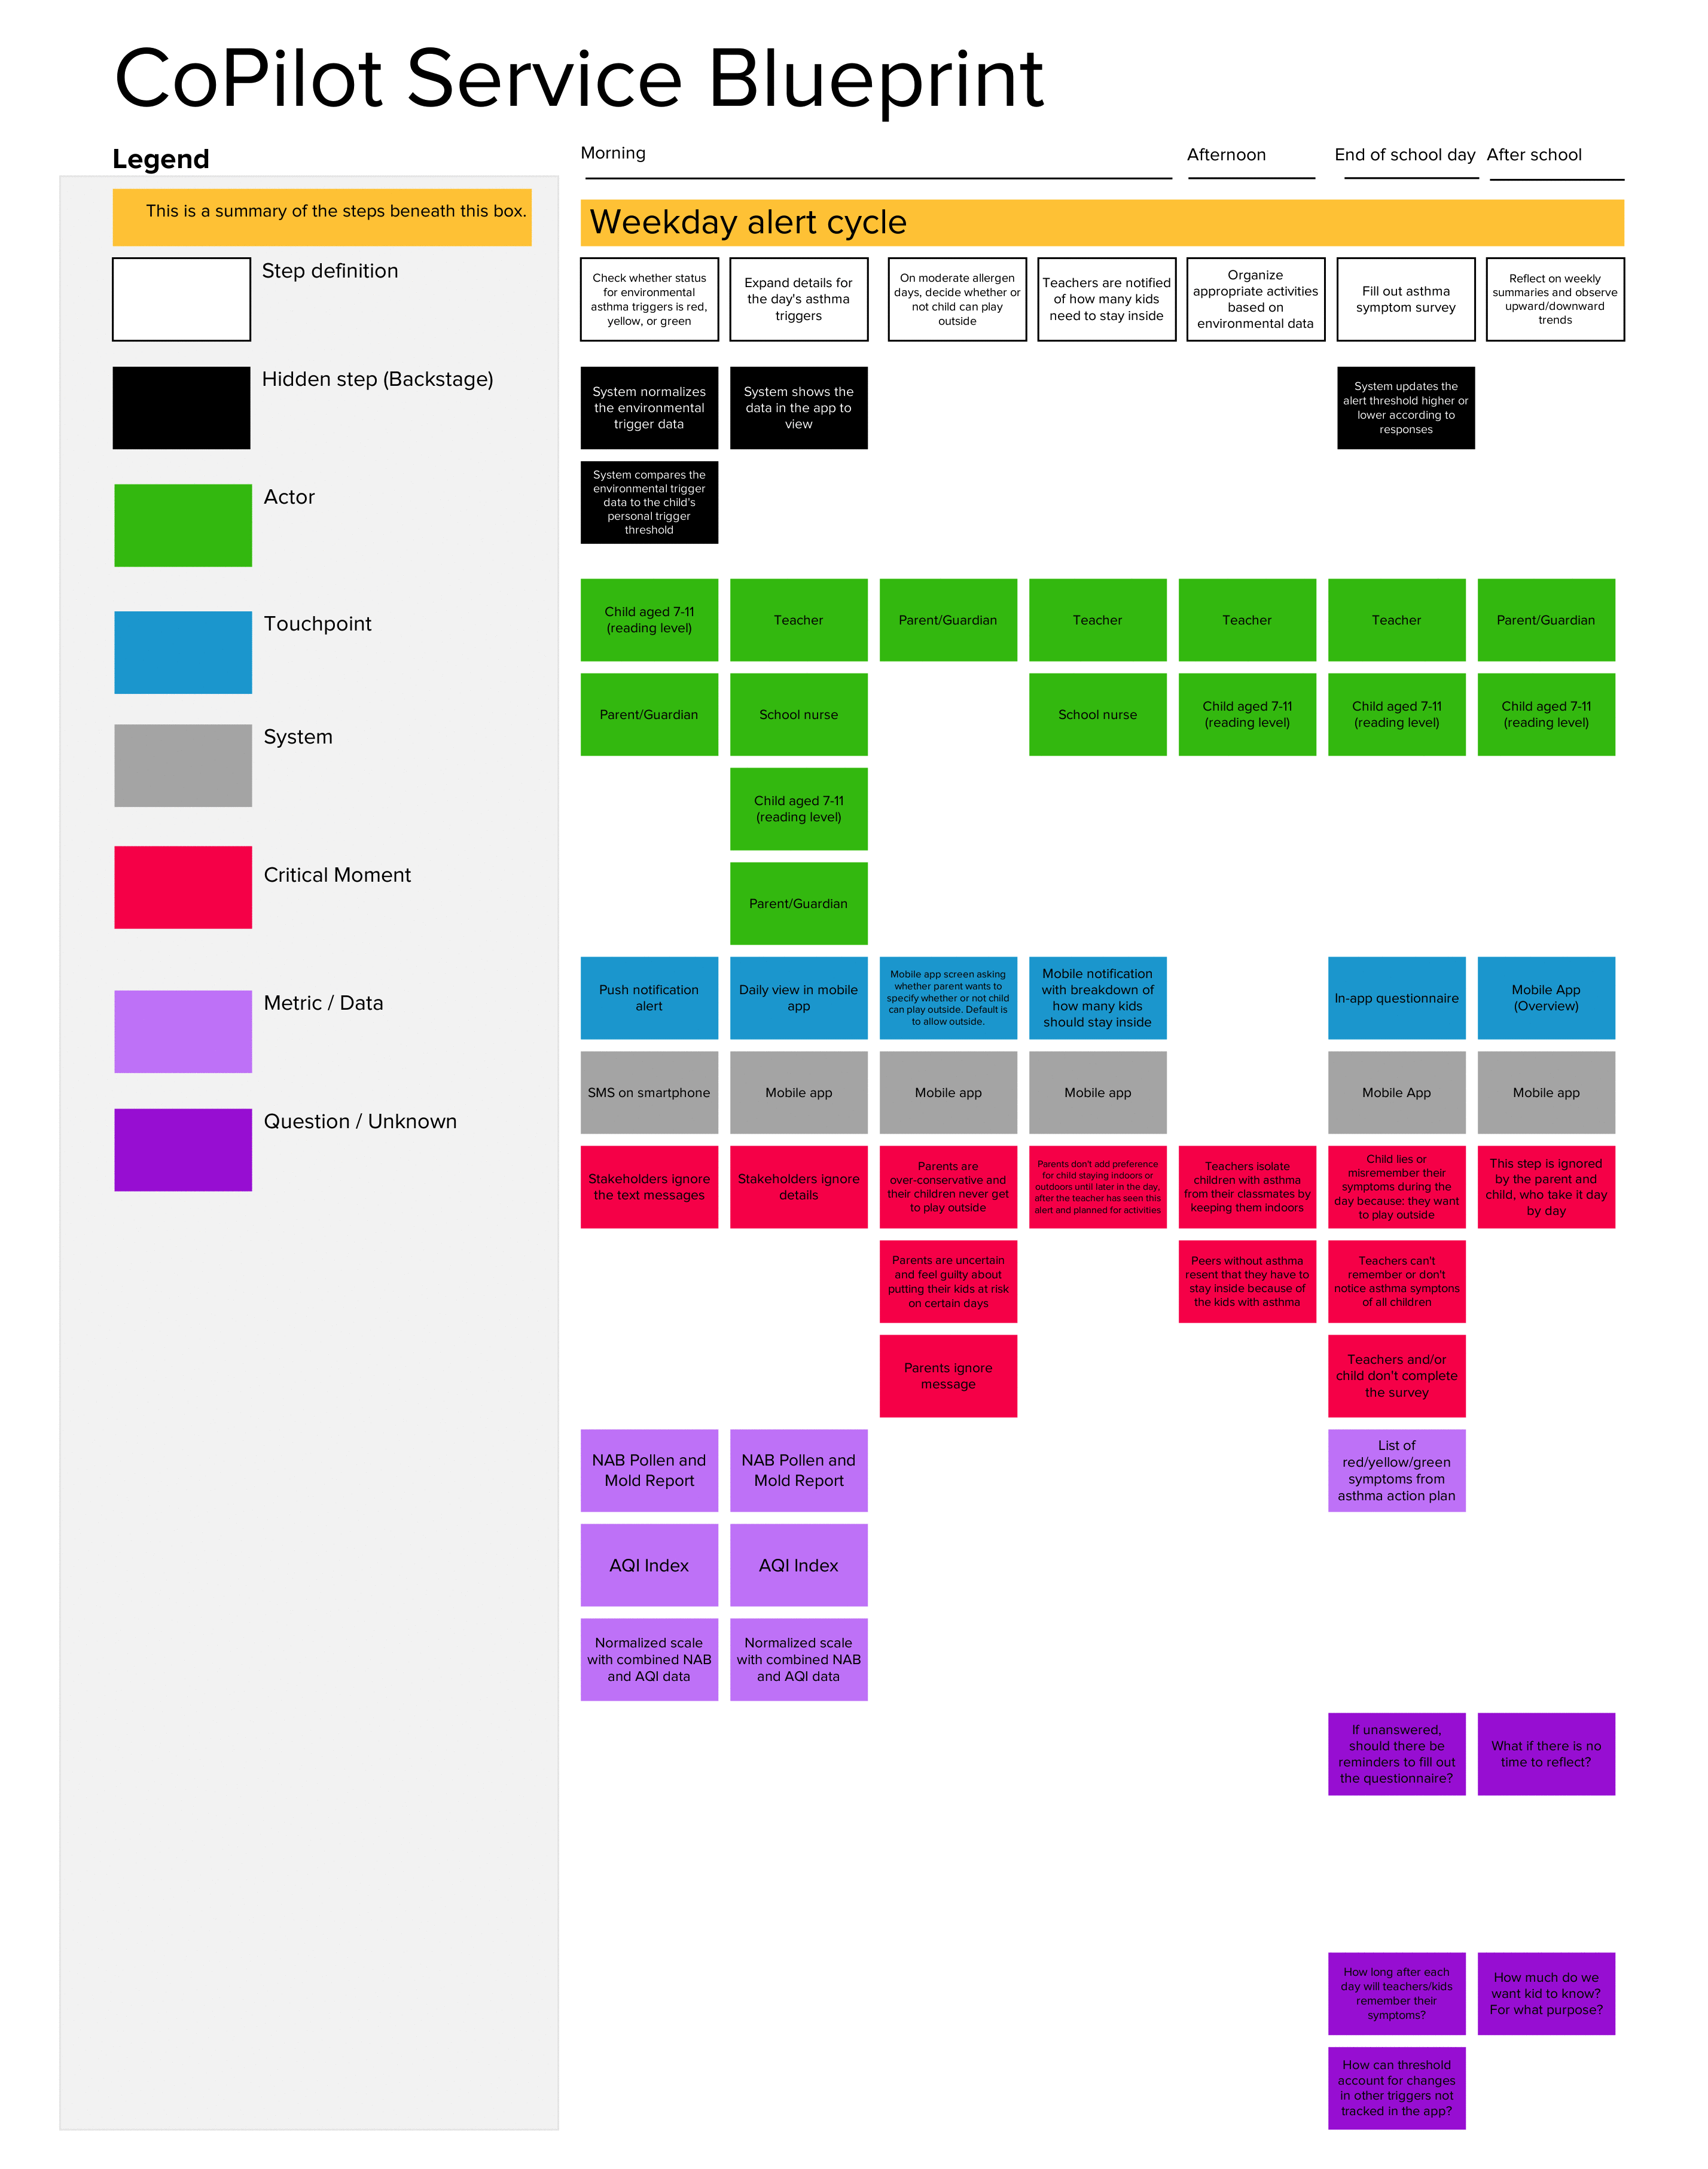
Service blueprint
As our understanding of the problem space and our design concepts changed, we sketched out evolving versions of our service blueprint. The blueprint shows the "frontstage" touchpoints that users interact with over a period of time. For each of these touchpoints, we included details on the "backstage" system flow, interaction type, and potential breakdowns.
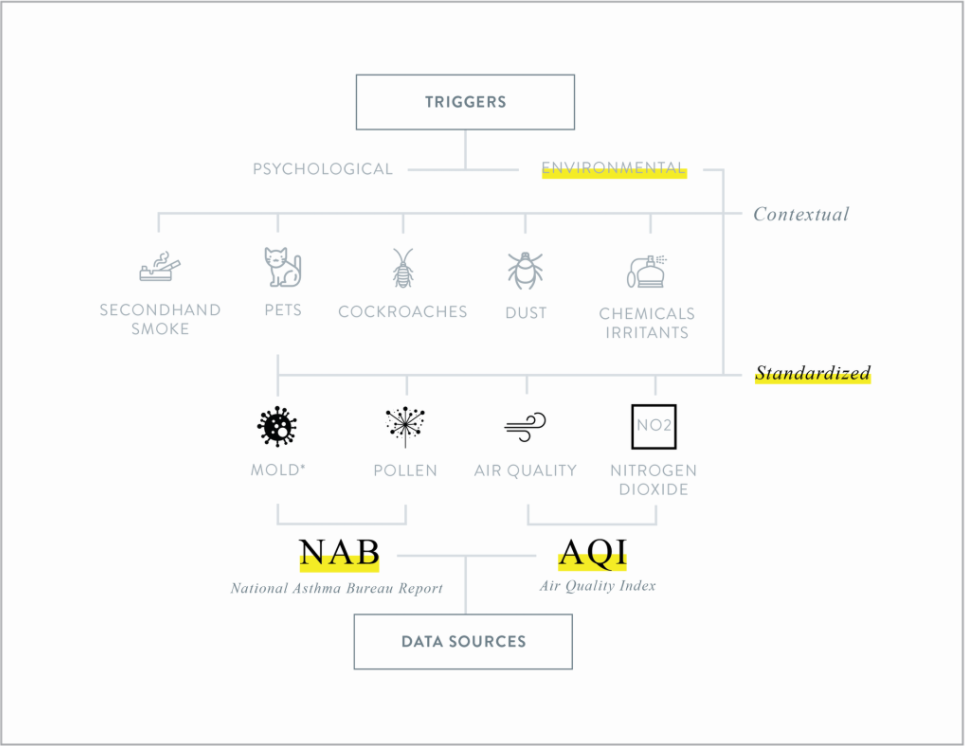
Data Design
Next, as our service evolved to rely more on real-time changes in environmental conditions, we began researching which environmental asthma triggers we could pull from existing data sources. The service could be designed to update the threshhold based on user input (aka "feedback questions") of a child's symptoms near the borders of a threshhold — to begin with, these could be the standard categories for low/medium/high as defined by the data collection groups. For example, if over time a child is consistently displaying asthma symptoms even during low/medium days, the threshhold could move lower. For more on our experience exploring data, see the Medium post I wrote in collaboration with Michelina Campanella and Jeffrey Chou on Prototyping with Data.
Screen map
Finally, our UI designer mocked up several key app interactions our service blueprint. I organized the screen designs into a screen map showing the notification and views for children, teachers, and primary caregivers.
Evaluate Solutions
Presentation to Philips
We presented a pitch deck and video to Philips. Our presentation for Philips validated that our group was exploring areas of direct interest to in-house air quality researchers for Philips. In particular, they were interested in the idea of the personalized and dynamic thresholds for alert, since each child has unique and changing asthma symptoms. However, they also noted concern about the reliance on parent and teacher input in order to update the threshold.
Future Opportunities
In the future, we'd be interested to test the alert frequency and messaging language over time. For example, are users willing and able to input asthma symptoms accurately? We'd also be interested to learn more about the optimal timing for these user input touchpoints. Additionally, while we didn't have time to explore data visualization in depth, we'd be interested to play around with the amount of data to present to the children and caregivers: how much fine-grained information about allergen trends do they care about? Finally, we would need to further flesh out how data from monitoring centers could be pulled and structured for the app, and build out a basic algorithm to update a threshold based on user input. Upon building this out, Philips could conduct research into the reliability and validity of the personalized thresholds.