Stockgrok: Make investment decisions through sound
Overview
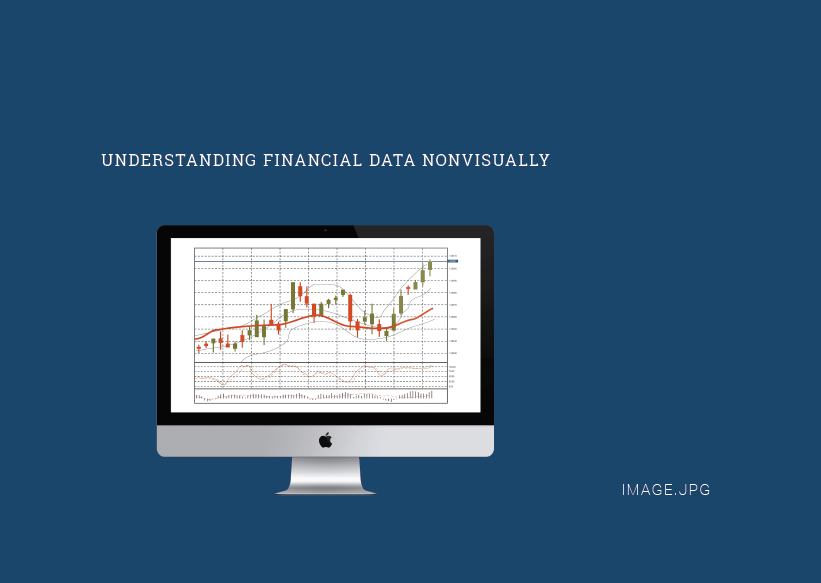
Bloomberg came to us with a problem: People with visual impairments are at a major professional disadvantage in finance because most data is presented in visual graphs. I worked with a team of five over eight months to research and design a solution to close that gap.
Project Details
Role
Interaction Designer & UX Research Lead
Tools
InDesign, Illustrator, Sketch, Mural, Google Forms, Google Sheets, Keynote, Streak CRM
Product
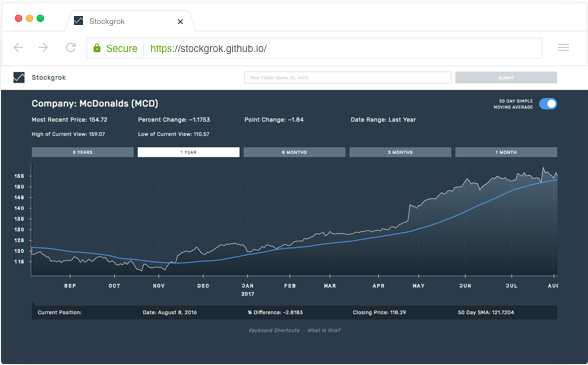
Stockgrok is a web-based audio-visual tool to allow people across the sighted spectrum to explore stocks with technical indicators that are crucial for investment. This product was the culmination of an eight-month capstone project for Carnegie Mellon's HCI Master's degree with Bloomberg as our client sponsor.
Read a deep dive on the creation of Stockgrok or check out the live Stockgrok web app.
Findings into a secondary research report, in which I wrote and designed the chapter An Overview of People with Visual Impairments.
Spring Research Book
Research
Prior to developing Stockgrok, I led user research with visually impaired users in data-centric fields. After summarizing the exising literature in a report entitled "Accessibility, Visual Impairment, and Finance," we compiled our findings into an insights report about the state data analysis tools for people with blindness and low vision:
Insights Report: What Am I Missing?